-
 10–15 minutes
Institutional Traceability: How to Build the Operating System of AI Governance
Read More ->: Institutional Traceability: How to Build the Operating System of AI GovernancePolicy engines execute governance decisions. But institutions also need a way to reconstruct those decisions, the controls in effect at the time, and the evidence that supports them. Institutional traceability is the layer that turns a governance stack into a verifiable system of record.
-
 8–12 minutes
AI Policy Engines: How to Operationalize AI Governance for Financial Institutions
Read More ->: AI Policy Engines: How to Operationalize AI Governance for Financial InstitutionsEvaluation can show whether an AI system is performing acceptably. It cannot, by itself, decide what should happen next. AI policy engines fill that gap by translating governance logic into repeatable runtime decisions across agents, applications, and workflows.
-
 9–14 minutes
How to Evaluate AI Agents: Building a Governance Framework
Read More ->: How to Evaluate AI Agents: Building a Governance FrameworkAI gateways control whether a model call is allowed to happen. Evaluation systems determine whether autonomous behavior remains acceptable after that access has been granted. In financial institutions, that means measuring performance continuously, defining thresholds explicitly, and inserting human review or restrictions before failure becomes systemic.
-
 8–12 minutes
AI Gateways: The Control Plane for Model Access
Read More ->: AI Gateways: The Control Plane for Model AccessIdentity, lineage, and semantics make AI systems interpretable. They do not, by themselves, control model access. AI gateways are the enforcement layer that determines whether a model call is allowed to happen at all, which model path is permitted, and what runtime constraints apply.
-
 8–12 minutes
Semantic Layers: The Hidden Infrastructure Behind Scalable AI
Read More ->: Semantic Layers: The Hidden Infrastructure Behind Scalable AILineage can show how a decision was made. It cannot guarantee that the data, features, rules, and policy terms behind that decision meant the same thing everywhere they were used. That is the role of the semantic layer: to make business definitions machine-readable, reusable, and governable so AI systems can operate correctly at scale.
-
 6–9 minutes
Data Lineage as the Trust Backbone of AI Governance
Read More ->: Data Lineage as the Trust Backbone of AI GovernanceMost financial institutions say they have data lineage. What they usually have is a reconstruction layer: metadata inferred from logs, scheduler state, warehouse queries, notebook history, catalog scans, and pipeline definitions. That is useful for debugging. It is not enough for governance. That distinction matters more as AI moves deeper into regulated financial activity. When models and agents influence credit decisions, fraud controls, transaction monitoring, customer servicing, trading workflows, or risk operations, lineage stops being a reporting convenience. It becomes part of the control environment. This is the next layer in the governance stack. Governance establishes the need for control.…
-
 5–8 minutes
Identity for AI Systems: The Glue That Holds AI Governance Together
Read More ->: Identity for AI Systems: The Glue That Holds AI Governance TogetherAI systems are starting to behave less like tools and more like participants in an operating environment. They retrieve data, apply transformations, and trigger downstream actions with increasing autonomy. As discussed in the shift toward machine-operational metadata, these systems are no longer just interacting with documentation, they are interacting with structured, executable context. Identity is what binds these systems together across data, decisions, and execution. In practical terms, identity in AI systems refers to cryptographically verifiable identifiers for agents, datasets, and transformations that enable traceability, accountability, and enforceable governance. The system can describe what exists, including datasets, pipelines, and agents,…
-
 5–7 minutes
Metadata for AI Agents vs. Human Metadata
Read More ->: Metadata for AI Agents vs. Human MetadataIn our previous article, we argued that governance is the prerequisite for scalable AI systems. As organizations move from experimentation to deploying autonomous agents, governance can no longer rely on human oversight alone. Policies, controls, and access rules must be interpretable by machines. For this to work, AI systems require institutional traceability: the ability to understand where information originated, how it was transformed, and what policies govern its use. Metadata is the layer that makes those controls executable. In order for AI agents to operate safely and reliably, metadata must evolve from human-oriented documentation into machine-readable infrastructure that encodes provenance,…
-
 6–10 minutes
Why Governance is the Precondition for Scalable AI Agents
Read More ->: Why Governance is the Precondition for Scalable AI AgentsScalable AI agents are quickly moving from experimental tools to embedded components of enterprise infrastructure. In financial services, manufacturing, retail, and other regulated sectors, autonomous systems are beginning to interface directly with ledgers, operational databases, and reporting pipelines. As these systems evolve from conversational assistants into operational actors capable of invoking tools, modifying records, and influencing downstream decisions, their risk profile changes materially. As explored in our article on AI agents in data analytics, these systems can automate everything from data ingestion to predictive insights. Why Traceability Becomes a Governance Requirement At this stage, AI agent performance alone is no…
-
 4–6 minutes
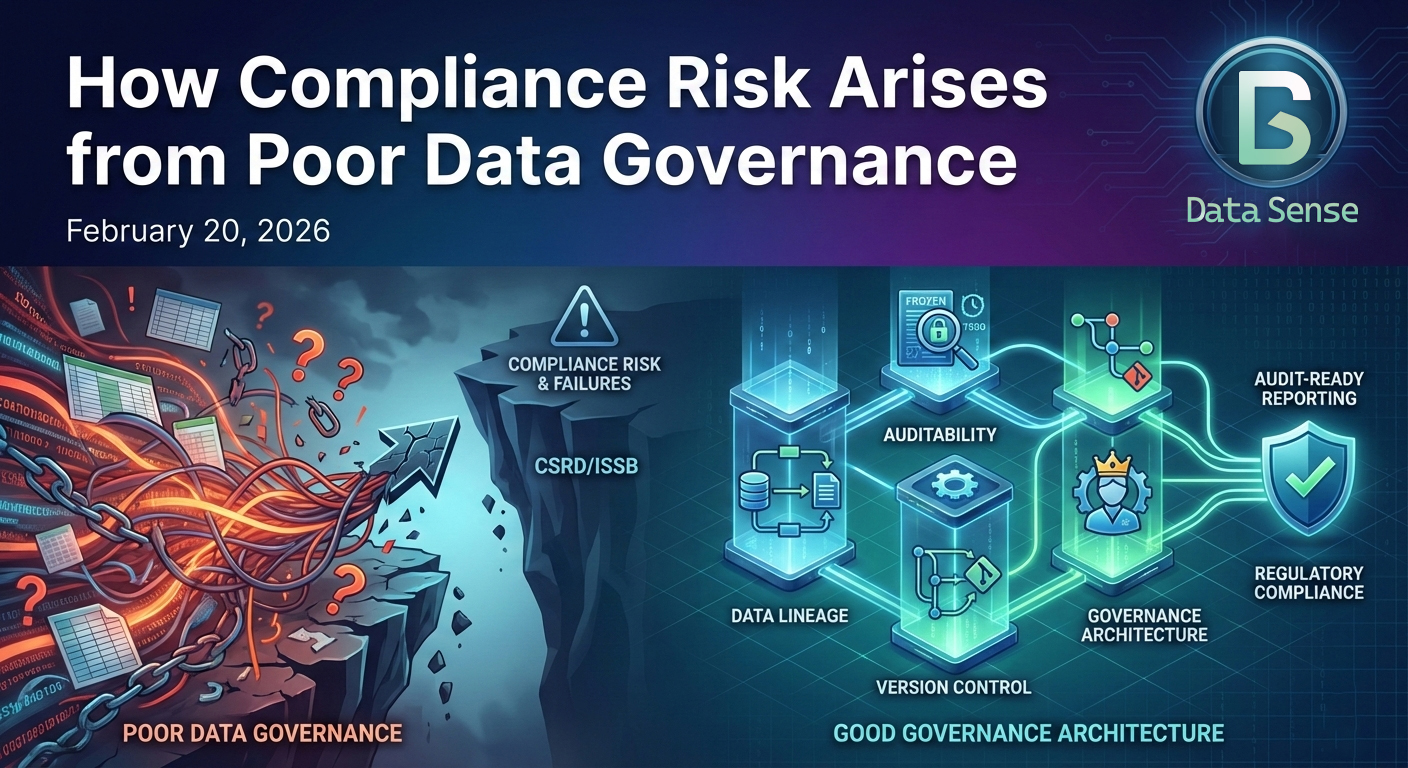
How Compliance Risk Arises from Poor Data Governance
Read More ->: How Compliance Risk Arises from Poor Data GovernanceMost compliance failures don’t begin with fraud. They begin with poor data governance and data management; inconsistently defined metrics, lack of ownership, scattered calculations and methodology. Under the Corporate Sustainability Reporting Directive (CSRD), climate and sustainability disclosures are subject to structured reporting standards issued by European Financial Reporting Advisory Group (EFRAG) and increasingly aligned with International Sustainability Standards Board (ISSB) standards.
-
 3–5 minutes
Automating a Risk Control Dashboard with Power BI MCP in Cursor for Free
Read More ->: Automating a Risk Control Dashboard with Power BI MCP in Cursor for FreeModern risk and control dashboards rarely fail because of visuals. They fail upstream, where definitions drift, calculations get re-implemented, and data governance lives in spreadsheets or people’s heads. In this walkthrough, I demonstrate how Power BI’s MCP (Model Context Protocol) can be used inside Cursor to automate much of that foundational work. MCP (Model Context Protocol) is an emerging standard that allows AI tools to directly inspect, reason over, and modify BI data models; including relationships, calculated fields, and semantic definitions. While the demo uses a triathlon training dataset, the workflow is identical to what we apply to risk and…
-
 3–5 minutes
How To Use Bayesian versus Frequentist Inference
Read More ->: How To Use Bayesian versus Frequentist InferenceIn financial risk management, debates about Bayesian versus frequentist inference are often framed as methodological or philosophical. In practice, the choice is far more pragmatic: it is primarily a data problem. Model risk, drift, and operational risk live upstream of market, credit, and liquidity models. They are shaped less by elegant theory and more by the realities of data volume, stability, and interpretability. This is where the distinction between frequentist and Bayesian inference becomes operationally meaningful.
-
 7–11 minutes
Creating an Ironman Training Dashboard with Google Antigravity
Read More ->: Creating an Ironman Training Dashboard with Google AntigravityBuilding a custom analytics dashboard usually means days of boilerplate: app scaffolding, callbacks, layout wiring, and database plumbing. All of that happens before you can even ask whether the dashboard is answering the right questions. This post walks through a small experiment: how far I could get building an Ironman training dashboard with Google Antigravity using minimal prompting, what that revealed about where LLMs accelerate dashboard development and where human judgment still matters most. The goal wasn’t a production-ready app. It was to shorten the distance between idea and working prototype.
-
 3–5 minutes
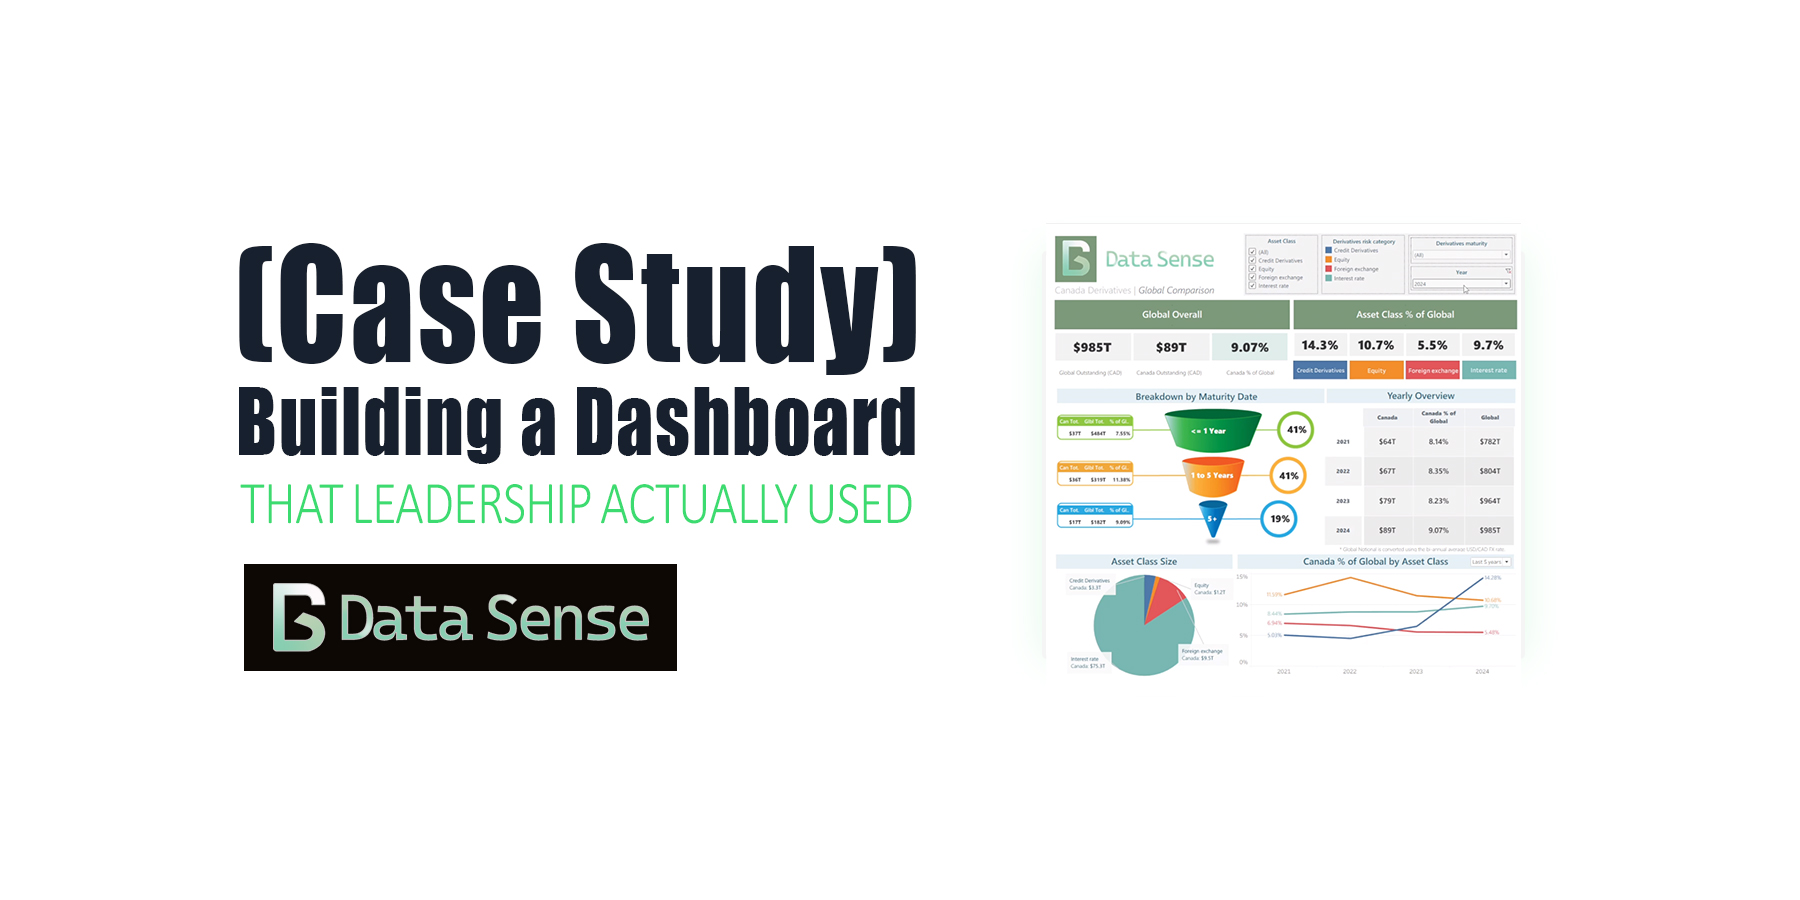
Building a Dashboard That Leadership Actually Used (Case Study)
Read More ->: Building a Dashboard That Leadership Actually Used (Case Study)A case study on a global derivatives dashboard. What started as a simple Tableau build ended up shaping future ETL automation, data scraping pipelines, and dashboards for years.
-
 4–6 minutes
How to Get Hired as a Financial Data Analyst with AI (2025)
Read More ->: How to Get Hired as a Financial Data Analyst with AI (2025)AI isn’t taking financial data analysts jobs, it’s changing the definition of them. In modern finance, the analyst’s role is evolving from reporting the past to predicting the future. Those who can harness AI-driven insights, automate workflows, and communicate results clearly are redefining what “analysis” means in the age of intelligent automation. For financial data analysts and data scientists, this shift brings new questions: Which skills are still essential? Which tools are becoming obsolete? And how do you stand out in a market where AI can write code, generate dashboards, and even summarize 10-Ks? This guide unpacks what the data…
-
 3–4 minutes
Top 5 Power BI Dashboard Tips to Improve Your Reports Today
Read More ->: Top 5 Power BI Dashboard Tips to Improve Your Reports TodayPower BI has helped democratize dashboards by giving anyone, from aspiring data analysts to business managers, the tools to explore, visualize, and share insights. Building a Power BI dashboard that looks good is easy, but building one that actually works takes intention. In our last article, we looked at why most Power BI dashboards fail and the five common mistakes behind them. This time, let’s fix them with five practical, easy-to-apply Power BI tips you can use today.
-
 9–14 minutes
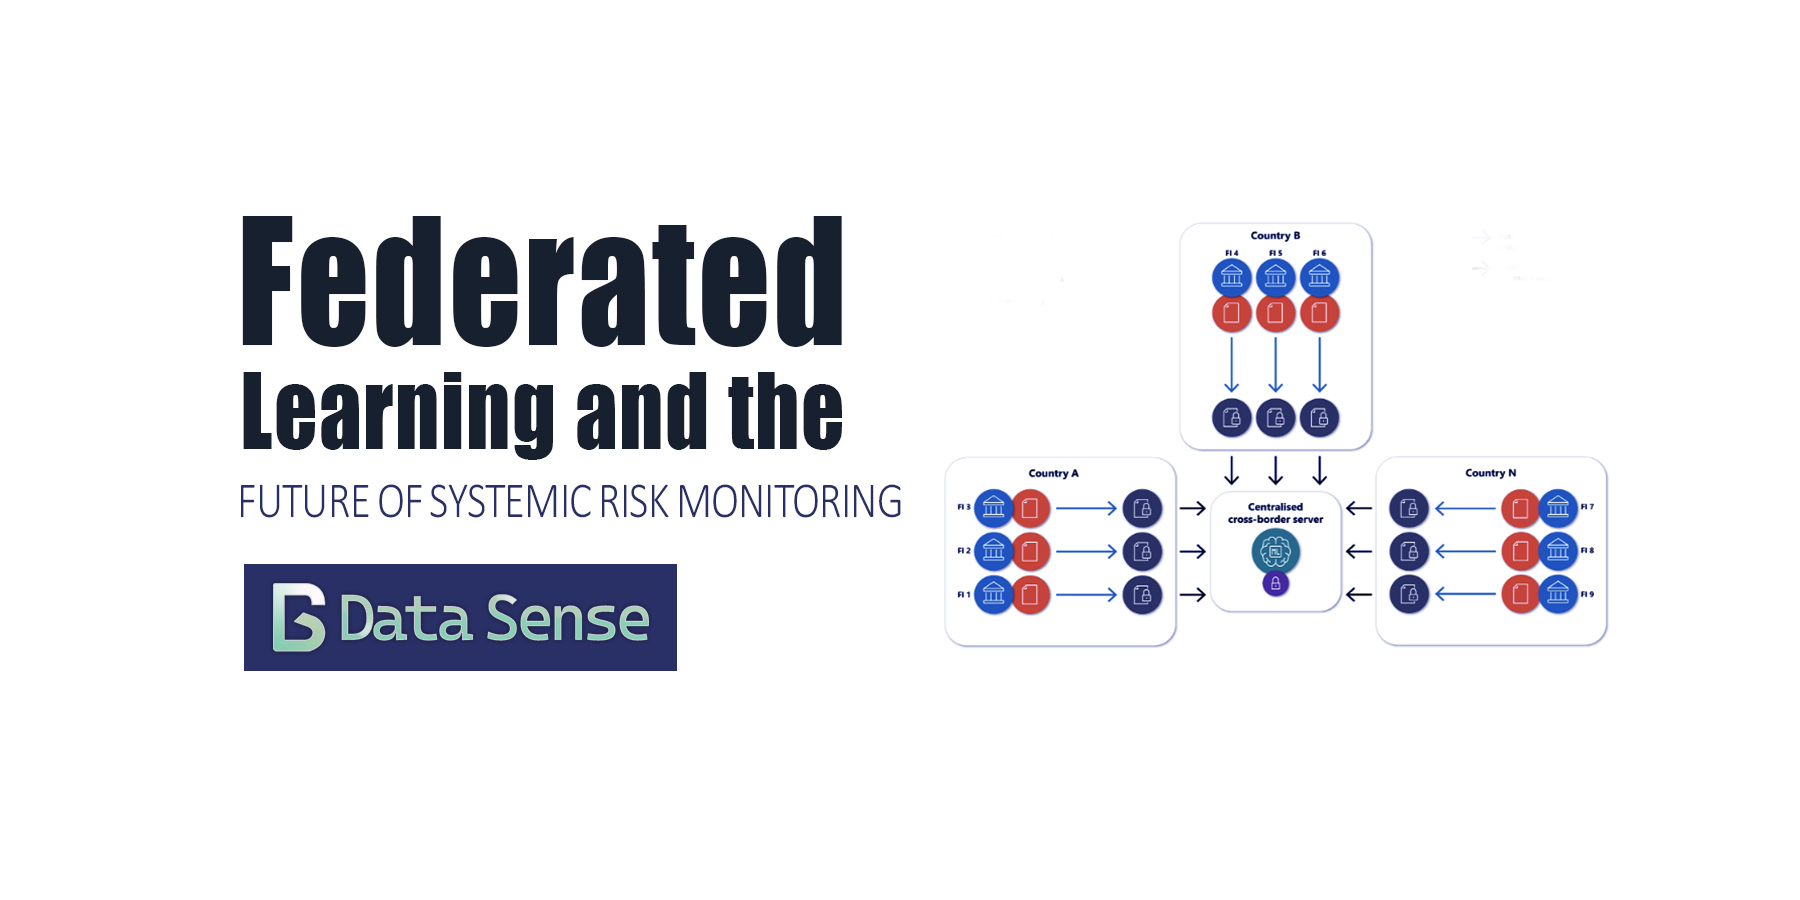
Federated Learning and the Future of Systemic Risk Monitoring
Read More ->: Federated Learning and the Future of Systemic Risk MonitoringCross-border financial data remains fragmented, siloed, and difficult to use for proactive risk oversight. With new privacy, AI, and governance rules tightening globally, collaboration between financial institutions has become both necessary and technically complex. Federated learning is a promising framework for overcoming these challenges.
-
 4–6 minutes
Why Most Power BI Dashboards Fail (5 Simple Fixes)
Read More ->: Why Most Power BI Dashboards Fail (5 Simple Fixes)Power BI has helped democratize dashboard creation by giving anyone, from sales aspiring data analysts to sales managers all the tools to build a great dashboard. Sadly, most of these dashboards end up in a folder somewhere, never getting the attention they deserve. Sometimes the issue is design; cluttered layouts, overuse of color, inconsistent filters. Other times, the data itself is messy, misaligned, or misunderstood. The result? Dashboards that look impressive but fail to inform. I’ve reviewed hundreds of Power BI dashboards being posted on LinkedIn, and the same five mistakes show up again and again. Here’s how to fix them in minutes…
-
 6–9 minutes
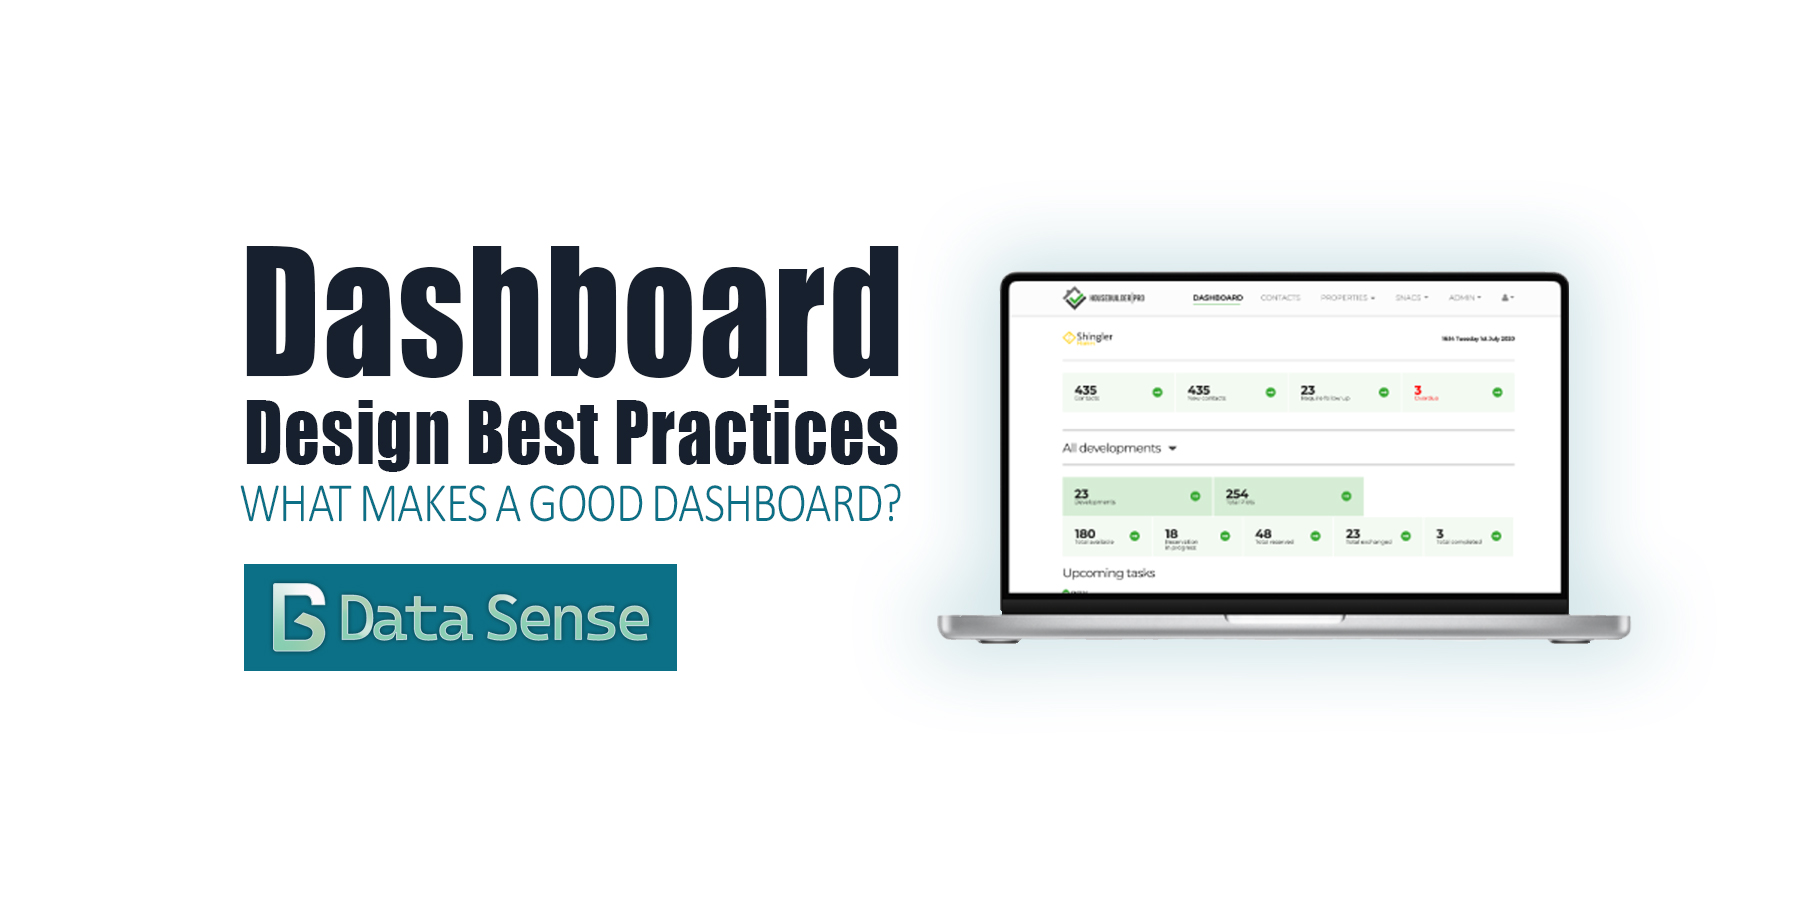
Dashboard Design Best Practices: From Charts to Clarity
Read More ->: Dashboard Design Best Practices: From Charts to ClarityOver the past few years, dashboards have become ubiquitous. Thanks to the “democratization of data visualization tools,” everyone is suddenly an analyst. With drag-and-drop interfaces and endless templates, it’s never been easier to pull data into a dashboard and share it with colleagues or executives. The problem? Most dashboards are bad. They don’t follow dashboard design best practices. You’ve probably seen them shared on LinkedIn: messy color schemes, overcrowded with charts, crammed into tiny panels, or spread across dozens of pages. They look neat, but they don’t communicate. At best, they confuse. At worst, they actively mislead.
-
 13–20 minutes
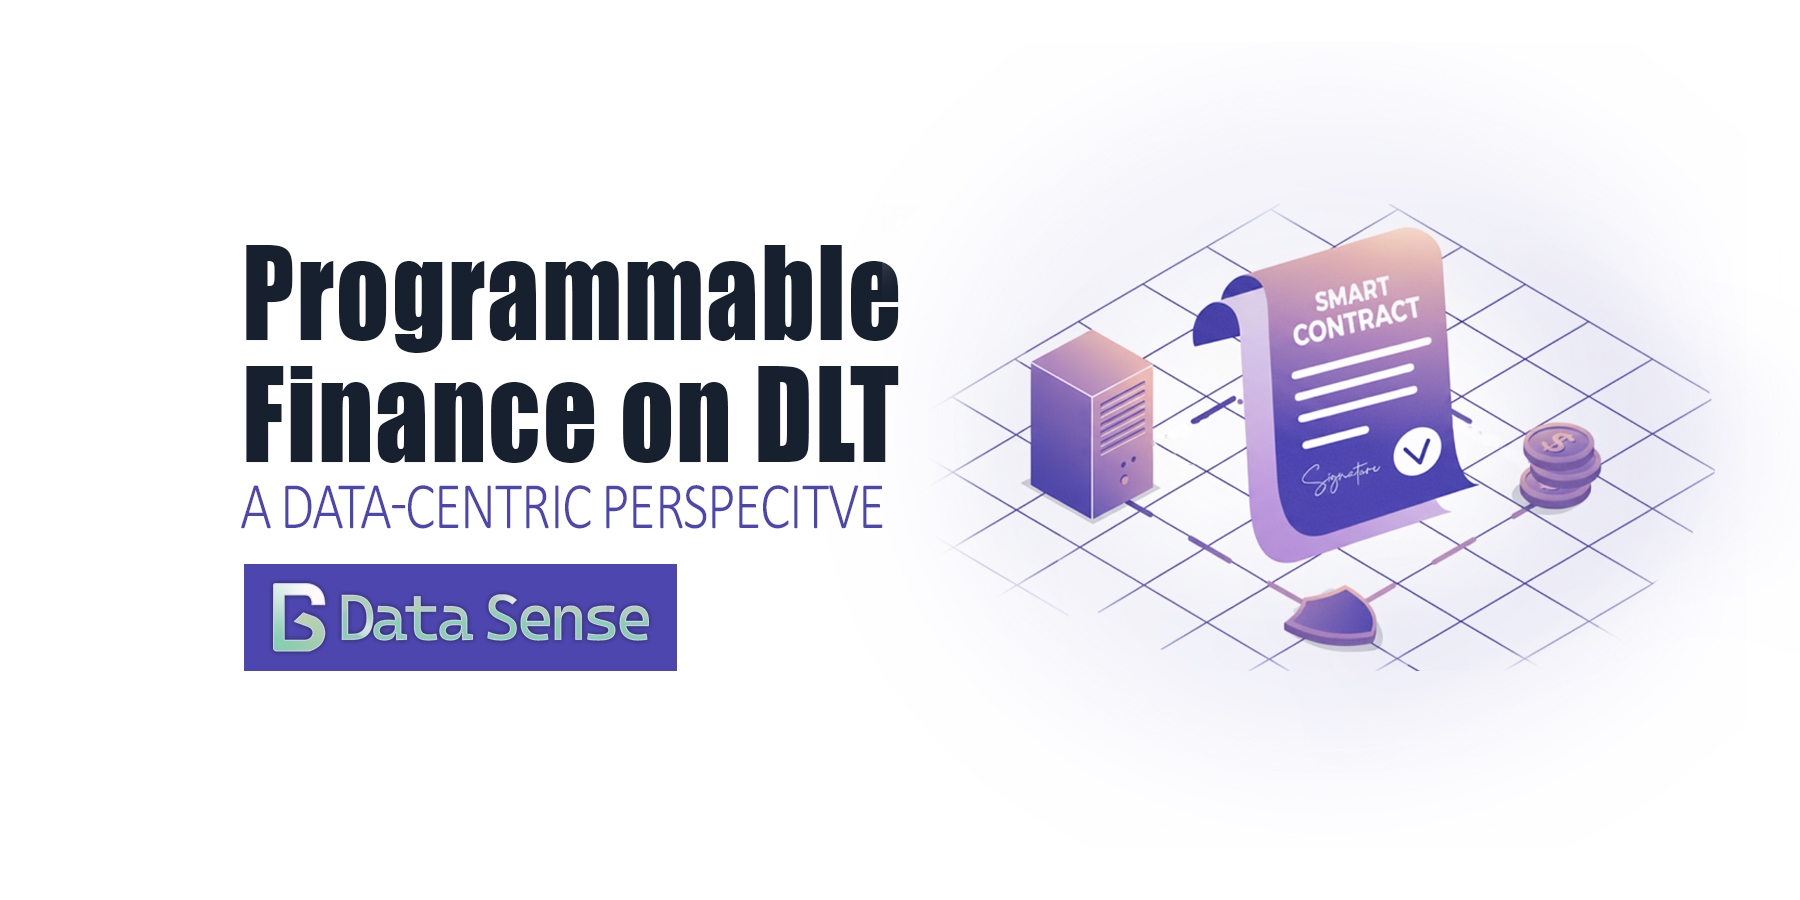
Programmable Finance on DLT: Data-Centric Perspective
Read More ->: Programmable Finance on DLT: Data-Centric PerspectiveIn this weeks article we discuss how distributed ledgers reshape settlement data, risk metrics, and privacy controls in financial markets. The rise of programmable finance on DLT is reshaping how financial institutions think about settlement, data governance, privacy, and risk. Unlike earlier blockchain hype, today’s experiments focus on the data foundations of trust: ensuring interoperability across rails, clear definitions of finality, and privacy-preserving analytics at scale.
-
 6–10 minutes
The Democratization of Data Visualization: Lessons from Plotly
Read More ->: The Democratization of Data Visualization: Lessons from PlotlyFor decades, data visualization was the guarded domain of BI specialists, statisticians, and data analysts. If an executive wanted a dashboard or a policymaker needed an analysis, they had to request it through a central analytics team and wait days or weeks for results. That world is gone. Today, thanks to platforms like Tableau, Power BI, and open-source frameworks such as Plotly Dash and Plotly Studio, almost anyone can spin up an interactive dashboard. This shift, known as the democratization of data visualization, promises faster insights, broader participation, and fewer bottlenecks from overworked data teams or gaps in expertise.
-
 18–27 minutes
How to Create and Validate Synthetic Financial Data in Python
Read More ->: How to Create and Validate Synthetic Financial Data in PythonRecently Data Sense published an article discussing how synthetic financial data is reshaping risk management in financial services. We detailed how financial regulators have begun to experiment and publish guidelines for implementing and assessing synthetic data for analytical fidelity and privacy preservation. But how can this actually be achieved? Extending our previous research, we have provided a framework below for economists, supervisors and financial data scientists to implement and assess synthetic data use cases. The objective of this tutorial is to help economists, supervisors, and financial data scientists gain practical experience in generating, validating, and assessing synthetic financial data using…
-
 8–12 minutes
Synthetic Data in Financial Services: Reshaping Risk
Read More ->: Synthetic Data in Financial Services: Reshaping RiskAs synthetic data in financial services gains momentum, evidence from the Financial Conduct Authority (FCA), the European Commission (EC), and central-bank forums shows it can help close cross-border visibility gaps in risk monitoring and systemic oversight When Lehman Brothers collapsed in September 2008, supervisors around the world struggled to see how risks were propagating through interconnected balance sheets and payment networks. Traditional reporting systems were too slow, too fragmented, and too siloed to provide the real-time visibility needed for effective oversight. More recently, the downfall of Credit Suisse in 2023 underscored how gaps in oversight and opaque cross-border exposures can still destabilize…
-
 16–23 minutes
Financial Data Automation ROI: A Data Professional’s Guide
Read More ->: Financial Data Automation ROI: A Data Professional’s GuideThe financial services sector is experiencing a data automation revolution, with 82% of CFOs increasing investments in digital technology in 2024, yet 49% of finance departments still operate with zero automation, relying on manual data entry and Excel spreadsheets (Solvexia, 2025). For data professionals, demonstrating financial data automation ROI has become critical as organizations seek measurable value from automated data pipelines, dashboards, and reporting frameworks. The business case for data automation has never been stronger, supported by compelling evidence from international organizations. The OECD’s 2025 “SME Digitalisation for Competitiveness” survey demonstrates that digitalisation can unlock SME competitiveness by helping SMEs…
-
 42–63 minutes
How to use GraphRAG for Economic Data Analysis (Tutorial)
Read More ->: How to use GraphRAG for Economic Data Analysis (Tutorial)This tutorial details how to create a GraphRAG (Graph-based Retrieval Augmented Generation) to conduct economic data analysis. It will focus on combining World Bank Data with Unstructured Reports. Introduction In today’s data-driven world, economic analysts are plagued with information in various forms. This can create a significant challenge in being able to extract valuable insights that are scattered across structured databases and unstructured documents. While the World Bank’s World Development Indicators (WDI) provide rich quantitative data, the context and explanations for economic trends often lie within IMF reports, OECD analyses, and policy papers. Traditional Retrieval-Augmented Generation (RAG) systems struggle to…
-
 5–7 minutes
GraphRAG is The Next Evolution in Economic Data Analysis
Read More ->: GraphRAG is The Next Evolution in Economic Data AnalysisHow knowledge graphs are transforming economic analysis by connecting quantitative data with institutional insights The Challenge Every Economic Analyst Knows Too Well Economic analysis today presents a fundamental challenge: the data we need exists in two separate worlds that rarely speak to each other. On one side, we have rich quantitative datasets like the World Bank’s World Development Indicators, providing precise measurements of GDP growth, inflation rates, and unemployment figures across countries and time periods. On the other side, we have institutional reports from the IMF, OECD analyses, central bank communications, and policy papers that explain the “why” behind the…
-
 9–14 minutes
12 Amazing Dashboard Tools for 2025
Read More ->: 12 Amazing Dashboard Tools for 2025The data landscape in 2025 is more dynamic and demanding than ever before. The data landscape in 2025 is more dynamic and demanding than ever before. Businesses are drowning in data but starving for insights. Manual data wrangling, complex setups, and the perpetual need for specialized data teams often trap great ideas and stifle agility. While dashboards remain a cornerstone for performance measurement and reporting, the definition of a “modern solution” has evolved far beyond static visualizations. Today, modern problems require intelligent, automated, and truly intuitive solutions. The real revolution isn’t just in visualizing data, but in intelligent systems that…
-
 3–5 minutes
Uncover the Power of AI Agents in Data Analytics
Read More ->: Uncover the Power of AI Agents in Data AnalyticsArtificial Intelligence (AI) is rapidly transforming every industry, and data analytics is no exception. While traditional analytics tools have empowered businesses with insights, the next frontier lies in AI agents: autonomous or semi-autonomous systems capable of performing complex data tasks, from collection and cleaning to analysis and even recommendation, with minimal human intervention. At Data Sense, we do not believe AI agents will replace human analysts, but rather augment their capabilities, freeing them from mundane tasks and allowing them to focus on strategic thinking and interpretation. This shift promises unprecedented efficiency and deeper, more timely insights. What are AI Agents…
-
 10–15 minutes
Telling Amazing Stories with Data
Read More ->: Telling Amazing Stories with DataThe secrets of story telling There is nothing worse than a presenter who throws up a PowerPoint and begins to read off the screen. Despite how good the presenters data and analysis may be, the presentation comes off as dull and boring and leaves the audience with little recollection of the information. There’s an art to telling a good story, and we all know a good story when we hear one. But there’s also a science behind the art of storytelling with data. The more a speaker conveys information in story form, the closer the listener’s experience and understanding will…
-
 7–10 minutes
Best Practices for Adapting Data Visualization for the Mobile Devices
Read More ->: Best Practices for Adapting Data Visualization for the Mobile DevicesIn an era defined by rapid digital transformation, our interaction with data is undergoing a remarkable shift. As smartphones continue to dominate how we access information, the demand for data visualizations that captivate and inform on smaller screens is at an all-time high. This evolution is not just about aesthetics, it’s about making valuable insights accessible to everyone, anywhere. According to data collected by Statista, as of 2023, mobile devices accounted for almost two-thirds (58%) of all global web traffic, highlighting the need for innovative mobile-friendly data visualization approaches. The limited screen space requires innovative thinking, pushing designers to create…
BROWSE PAST POSTS
Blog Archives
Explore our entire collection of articles, organized by publication date.
Posts from
sensi
View Year:
©2025 Data Sense. All rights reserved.